

New research into Vermont’s short-term rental (STR) market conducted by Vermont Housing Finance Agency (VHFA) has revealed 16,000 distinct whole-unit listings were available during the year between September 2024-2025. This data represents 43,000 total bedrooms (about 4.6% of the state’s housing stock). During that period, the number of homes available as STRs ranged from 10,000 to 12,000 per month (about 3.5% of the state’s housing stock).

Figure 1‑1 Vermont active, whole-unit short-term rental listings by month, 2018-2025
Source: VHFA analysis of AirDNA short-term rental records
Defining Short-Term Rentals (STRs)
Short-term rentals (STRs) are homes that are rented out for less than 30 days, or not an annual lease. STRs are typically fully-furnished and often used for tourism or short-term business travel. Because they are not leased for a full-year, STRs are not beholden to landlord-tenant law in Vermont. This arrangement allows the owner to list their home sporadically (i.e. on weekends), seasonally (i.e. the entire Winter), or full-time with various guests instead of a continuous leased tenant.
The share of Vermont’s housing stock used as STRs is higher than the national average. According to AirDNA, there were an estimated 1.7 million active short-term rentals available in the US per month in 2025, representing 1.2% of the country’s total housing stock, compared to 3.5% in Vermont. This follows a historic trend of high rates of secondary/seasonal home ownership in Vermont, ranking in the top three states nationally on every Decennial Census since the 1940s. While secondary homes are not directly correlated to homes used for short-term rental, they are both consistently found in tourism-focused areas of the state and country.
The data analysis used originates from monthly short-term rental listings on AirBNB and VRBO, compiled by AirDNA. This data is filtered and analyzed by VHFA to only include actively-listed, entire-unit rentals.
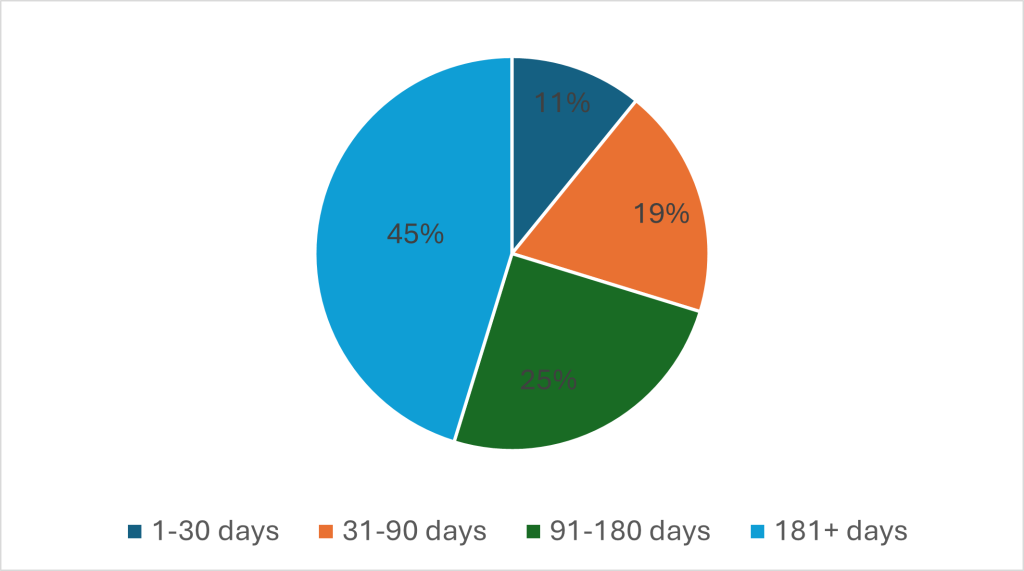
Days Listed: 70% are available 90+ days a year
Of the 16,000 total STRs listed for at least one night between September 2024-2025, 11% (1,800 listings) were available for less than 30 nights over the course of the year, while 70% of STRs (11,500 listings) were available for 90+ days. This information suggests most listings are used primarily for short-term rental. In the month of September 2025, 67% of all active listings were available for more than 15 nights. This indicates that most units currently used for STRs are most likely used primarily for this purpose as opposed to homeowners renting their home for short stays while they are out of town.
Figure 1‑2 Vermont homes used for short-term rental by number of days listed, Sept. 2024-2025
Source: VHFA analysis of AirDNA short-term rental records
Seasonality: September listings peak (12,000); but February generates the most revenue
For the years where data is available, the volume and revenue generated from STR listings have followed a seasonal trend whereby the number of active listings peaks in September and dips to its lowest point in February. In the past year, there were 12,000 listings in September vs. 10,000 listings in February approximately a 20% difference. This increase aligns with the seasonal fluctuation seen in other previous years, but for both periods marks their highest number of monthly listings. While this represents only a 4.4% increase from the prior peak month of September 2024, it represents a 42% increase in monthly STR listings since September 2019.
Conversely, the median revenue generated per listing follows the opposite trend as the number of monthly active listings. Since 2019, data shows that the median revenue per home peaks in February and dips to its lowest point in September. This year, median revenue per home peaked in February at $4,238 per month per listing. This amount is not only 2.5 times greater than the median revenue generated per home in September 2025 ($1,684/month/listing), it's also twice the amount generated per home in February 2019. Overall, the median annual revenue for a whole-unit STR listing was $22,046 with a median daily rate of $321/day from September 2024-2025.
Figure 1‑3 Monthly home listings and median revenue for Sept and Feb 2019, 2022, and 2025
Source: VHFA analysis of AirDNA short-term rental records
|
Home Listings peak in Sept/Oct |
Median revenue peaks in Jan/Feb |
| Sept 2019 – 8.4k listings ($1,461/month) | Feb 2019 - 7.0k listings ($2,120/month) |
| Sept 2022 – 9.3k listings ($2,401/month) | Feb 2022 - 7.4k listings ($4,222/month) |
| Sept 2025 – 12k listings ($1,684/month) | Feb 2025 - 10k listings ($4,238/month) |
|
43% peak listing increase since 2019 |
100% peak revenue increase since 2019 |
Home Types: 6,000 single family home listings & 4,000 homes in multifamily buildings
New analysis into the home types of STR listings reveals that most listings in the state are non-specialty listings. Of the 12,000 homes analyzed, 5,900 homes are identified by their host as a “house,” representing nearly half of all listings in the state. Beyond those homes, a number of more distinct home types that could be classified as single family homes but are more distinctly related to the tourism economy were among the most common listing types. These included 1,000 homes identified as “cabins” and 400 identified as each of the following categories: cottage, chalet, townhouse, and miscellaneous specialty.
In terms of multi-family housing, 1,900 are listed as an “apartment” (16%) and an additional 1,800 were listed as “condos” (15%). The proportional breakdown of units by type remained consistent throughout the year.
Figure 1‑4 Breakdown of Vermont short-term rentals by host-defined home type, 2025
Source: VHFA analysis of AirDNA short-term rental records
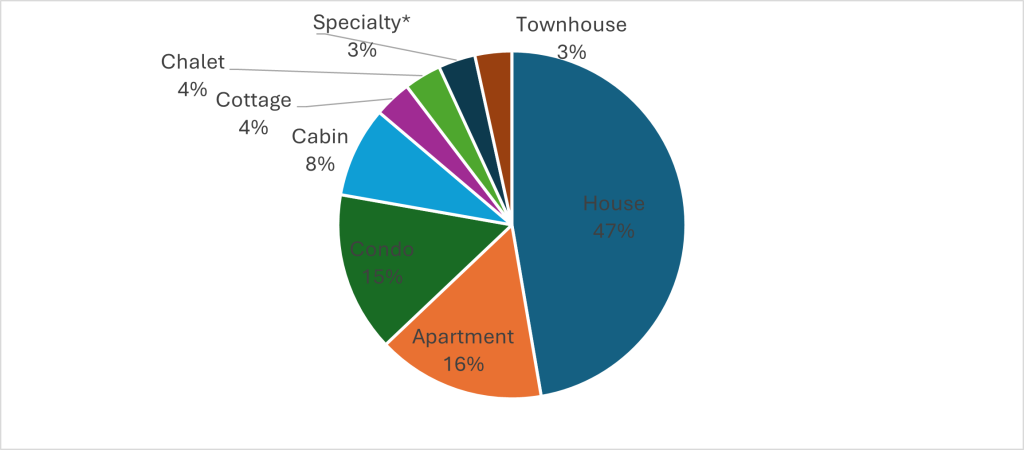
*Home types defined by host of short-term rental. Specialty units include: Barn; Boat; Castle; Dome house; Earth house; Farm stay; Farmhouse; Hut; Island; Lodge; Loft; Place; Shipping container; Tipi; Treehouse; Yurt
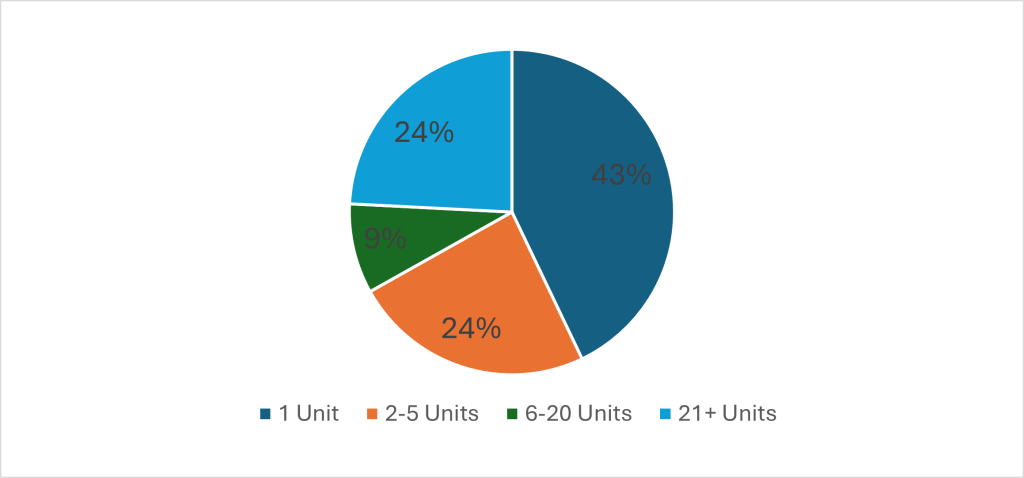
Host characteristics: Small in-state hosts, with a notable number owned or managed by out-of-state buyers/managers
Data regarding STR host characteristics reveals that most listings in Vermont are managed by a host with less than 5 distinct listings. On a monthly basis, 67% of those hosts have less than 5 units, and 43% have only 1 unit. On the opposite end of the scale, 25% of the listings in Vermont are managed by a large host with 20+ listings. Data about the ownership of these listings is incomplete, as many listings are managed by larger vacation rental companies for the true owner. As an example, Vacasa, a national management company, has more than 1,200 Vermont listings they do not own, representing more than 10% of the total active listings in a given month.
When filtered to a sample of 9,000 listings with identifiable host locations, the data shows that most hosts (5,300 or 60%) indicated Vermont as their primary location. The next largest category of hosts include 2,600 (or 29%) from bordering New England states, as well as New York and New Jersey. An additional 800 hosts listed another US state as their primary location and 120 listed another country.
Figure 1‑5 Vermont short-term rentals by number of units managed by host, 2025
Source: VHFA analysis of AirDNA short-term rental records
For more in depth information about Vermont’s STRs, visit the newly improved indicators on VHFA’s HousingData.org short term rental dashboard.