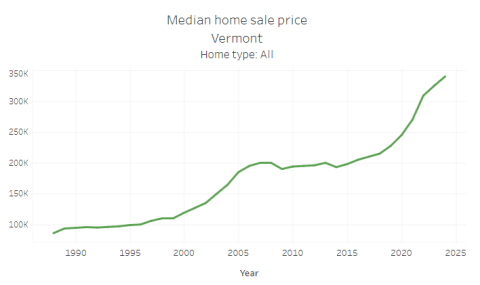
New Vermont Property Transfer Tax (PTT) data shows recent trends in the home sale market have continued in the first half of 2024. During that time, the median sale price of year-round homes increased an additional 5%, compared to the median price of $325,000 in 2023. At the same time, the median length of days a Vermont home is on the market for sale has remained at a historic low point, suggesting demand to buy homes in Vermont remains high despite increasing sale prices. Additionally, new analysis shows that secondary homes account for about a quarter of all Vermont home sales each year. These datasets, and many others about Vermont’s housing market, are available for free on VHFA’s housingdata.org.

Sales prices of year-round homes
The median sales price of a primary home in Vermont increased by 5% during the first half of 2024, reaching $340,000, according to recent Vermont Property Transfer Tax (PTT) records. Overall, median Vermont home sale prices have increased by 50% since 2019.
These figures, derived by the VHFA research team for housingdata.org, represent single-unit homes only used as primary residences, including single-family detached homes, condominiums, and manufactured/mobile homes sold with land.
Vacation home sales
Additionally, new analysis is available on housingdata.org examining secondary/vacation home sales. In 2023, there were 2,226 secondary homes sold in Vermont, with a median price of $392,250. Consistent with prior years, secondary homes accounted for 28% of all Vermont home sales in 2023. The number of secondary home sales peaked in 2021 when there were 4,055 sales, accounting for 33% of all residential sales that year.
Total home sales
Overall, residential sale volume was down in 2023 - there were 7,950 total residential sales (5,724 primary and 2,226 secondary), a 23% decline from the pre-pandemic level in 2019 (10,298 total sales, 8,281 primary, 2,647 secondary) and an even greater 41% decline from the recent peak sale year of 2021 (13,395 total sales, 9,340 primary, 4,055 secondary). This decline is likely due at least in part to the extended period of high interest rates mixed with ever-rising median home sale prices. Between 2019 and 2023, there were approximately 40,000 total home sales in Vermont, about 15% of the state’s housing stock .
Days-on-market
Median days-on-market is the median length of time a home is available on the sale market before entering a sale agreement with a new buyer. Vermont’s median days-on-market has decreased every year since 2016. That year, the median number of days a primary home was on the market was 137 days. By 2019, that had dropped to 99 days on market; in 2023, that figure dropped to 62 days. Days-on-market can be used as an indicator of demand in the home sale market. Decreasing days-on-market suggests potential buyers are eager to purchase the stock of homes available for sale.
While the overall volume of home sales decreased in 2023, the trend of declining average days-on-market has not been affected. Although there were fewer primary home sales in 2023, homes sold just as quickly that year as when the market peaked in 2021 and 2022. This suggests that there is still significant demand to purchase homes in Vermont, but there is waning interest in selling homes currently. This, again, may be caused by the extended period of high interest rates – homeowners may be less likely to sell now because they do not wish to lose their pre-inflation mortgage rates when they move.
Seasonal trends in home sales
The home sale market in Vermont follows seasonal trends, heavily impacted by the winter weather conditions that make it more difficult to both buy and sell a home in Vermont. This is born out in the days-on-market data – annually, February typically has the longest average days on market, while June, July, and August typically have the shortest average days on market.
Similarly, January and February are typically the months with the lowest total residential sales, while June through October typically have the most monthly home sales. Interestingly, sale volume did not follow the same seasonal trend in the second half of 2023 and did not peak between June and October as had been the case all prior years since 2019.
Conversions between primary and secondary use
VHFA researchers also used this recent home sales data analysis to take a special dive into the prevalence of out-of-state buyers and conversions between using homes as primary and secondary homes.
Annually, approximately 1,800 to 2,400 homes in Vermont change between primary and secondary usage, some from primary to secondary and some from secondary to primary. Since 2019, between 50 and 400 more homes each year have been converted to primary usage than have been converted to secondary usage, meaning the primary housing stock subtly grew through conversion each year. There are 1,044 more homes converted to primary usage than secondary usage since 2019, an average rate of 200 net primary homes per year during that time.
However, this only accounts for conversions during time of sale – should an owner change the way they use their home (between primary and secondary) mid-ownership, that conversion would not be captured by this data. While homes converted to primary occupation [LB5] only represent 0.3% of the state’s primary housing stock, they represent the addition of year-round homes needed to address short-range housing challenges such as a tight vacancy rate and rising homelessness.
Interested in purchasing a home in Vermont?
Vermont Housing Finance Agency (VHFA) programs are available to help moderate-income Vermonters become homeowners. For more information about VHFA’s affordable mortgage and down payment assistance programs, visit our homebuyer website.

