
 Few housing units in the U.S. are accessible for people with disabilities and even fewer are both affordable and accessible, according to a recent comprehensive study from HUD. About a third of housing in the U.S. is potentially modifiable for a person with a mobility disability, currently less than five percent is accessible for individuals with moderate mobility difficulties and less than one percent of housing is accessible for wheelchair users.
Less than one percent of U.S. housing is wheel chair accessible
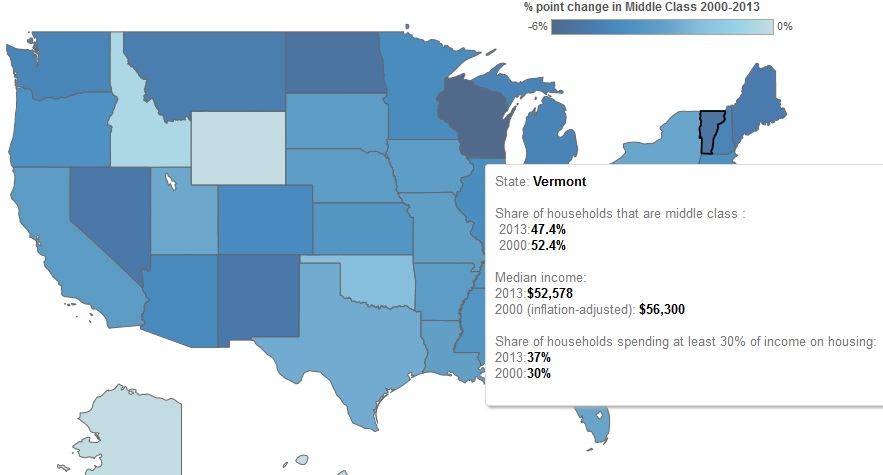
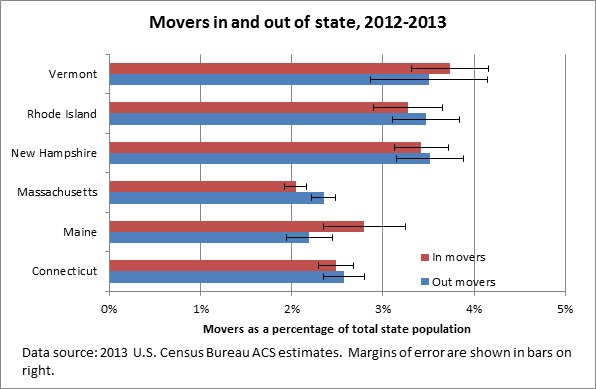 About 3.5% of Vermont’s population moved out of the state in 2012-2013—about the same number as those moving in, according to Census estimates. This means that the number of people moving in and out of the state had no net effect on the state’s total population.
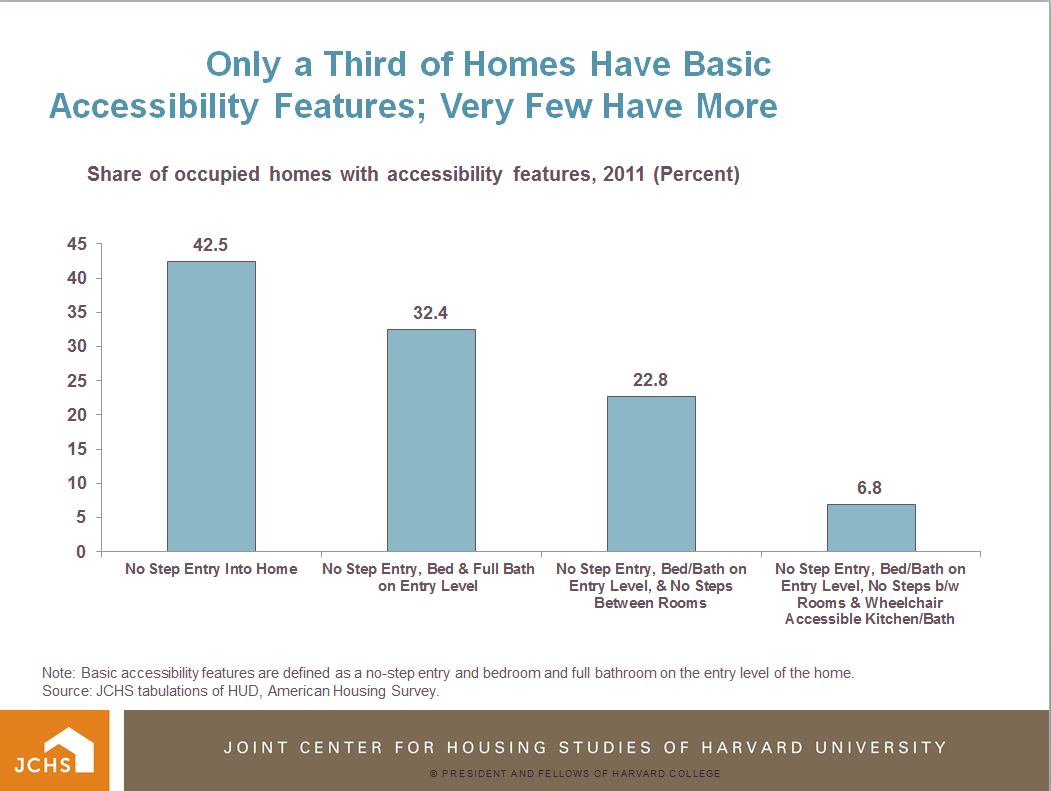 The average aging baby boomer plans to “age in place” which will create new levels of demand for remodeling of the currently inaccessible homes they live in, confirms a recent
  The average student loan balance is $30,000 among Chittenden and Windsor county residents between the ages of 18 and 44. Only three counties in New England rank higher, according to
 Check out this new report from the U.S. Department of Health and Human Services. The Support and Services at Home (SASH) program was launched in 2013 and has connected residents with community based health services. This program was set up to "decrease health care expenditures for elderly residents of affordable housing developments." Vermont SASH participants were studied in a recent evaluation of the program's first year of implementation.