2015 shows impact of VHFA tools for making homes affordable

Earlier this week, HUD published the final 2016 Fair Market Rent standards that will take effect as of tomorrow, December 11, 2015. FMRs are intended to represent the dollar amount below which 40 percent of the standard-quality rental housing units in an area are rented. They are used in HUD rental assistance programs, including the Section 8 and HOME programs.
In half of Vermont’s counties, the new FMRs are slightly higher than last year. However, in the more densely populated Burlington-South Burlington metropolitan area, FMRs decreased by about 8 percent due to a change in the methodology used there.
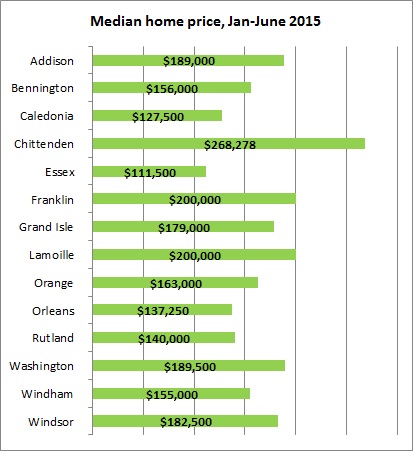 Despite the recovery taking place in most of Vermont's local housing markets, relatively high rents and home purchase prices continue to prevent many younger residents from buying their first home.
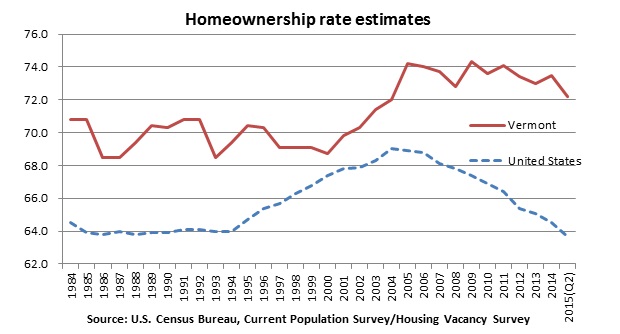 Although Census surveys show a clear decline in the national homeownership rate, they don’t show a similar decline for Vermont. At least not yet. Second quarter 2015 estimates show Vermont’s rate at 72 percent, nearly eight and a half percentage points higher than the national 64 percent rate.
Economists expect the national homeownership rate to reach a turning point soon, as the economic recovery and gradual credit standard loosening bring first-time buyers back to the market.
 Few housing units in the U.S. are accessible for people with disabilities and even fewer are both affordable and accessible, according to a recent comprehensive study from HUD. About a third of housing in the U.S. is potentially modifiable for a person with a mobility disability, currently less than five percent is accessible for individuals with moderate mobility difficulties and less than one percent of housing is accessible for wheelchair users.
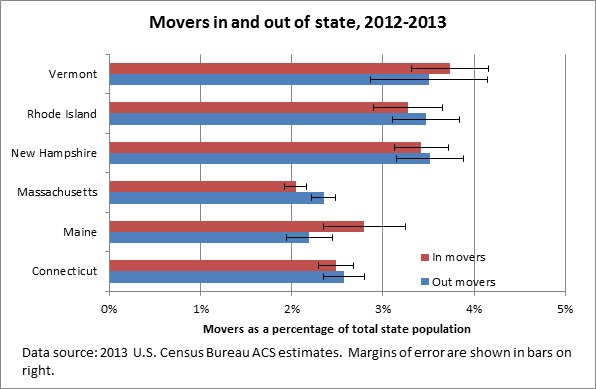 About 3.5% of Vermont’s population moved out of the state in 2012-2013—about the same number as those moving in, according to Census estimates. This means that the number of people moving in and out of the state had no net effect on the state’s total population.
Having equal sized flows in and out of the state is not unique for Vermont. The earliest estimates available in this format (for 2004-2005) show that roughly the same number of people moved in and out of the state in that year.
Vermont’s experience mirrors that of several New England states. Both Rhode Island and New Hampshire had in- and out-migration rates in the 3-4% range.
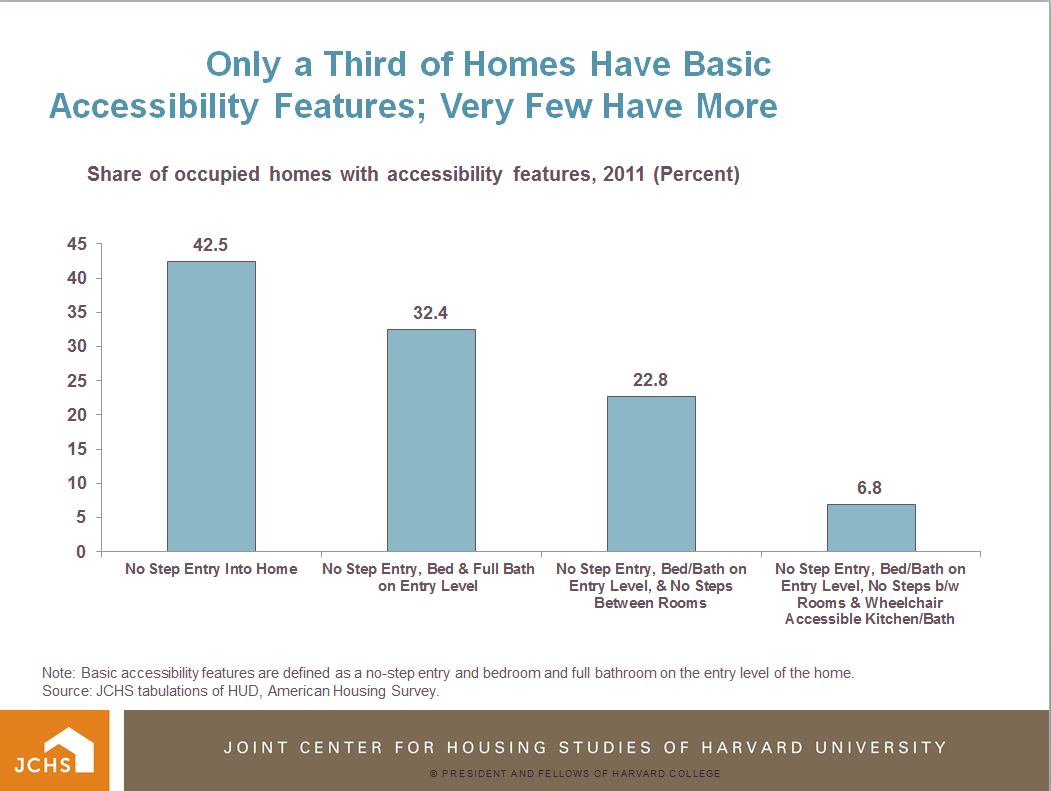 The average aging baby boomer plans to “age in place” which will create new levels of demand for remodeling of the currently inaccessible homes they live in, confirms a recent report from Harvard’s Joint Center for Housing Studies.
 The average student loan balance is $30,000 among Chittenden and Windsor county residents between the ages of 18 and 44. Only three counties in New England rank higher, according to recent research from the Federal Reserve Bank of Boston--Suffolk and Norfolk counties in MA and Grafton County in NH.
 We updated hundreds of estimates pertaining to the housing in Vermont’s communities on the Vermont Housing Data website last week. Many of these estimates originate from the Census Bureau’s annual American Community Survey.
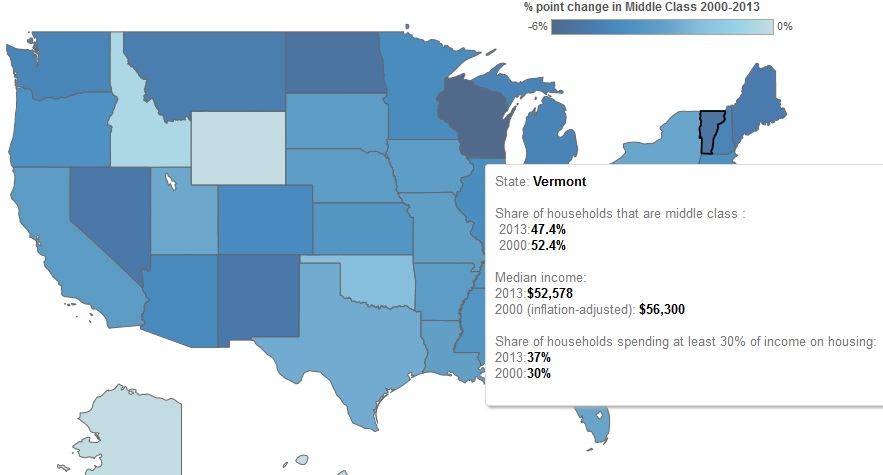 Vermont has lost more of its middle class households than most states in the country, according to recent research from the Pew Charitable Trusts. In 2013, 47.4 percent of Vermont households were middle class compared to 52.4 percent in 2000.
Similarly, the portion of Vermont households paying more than 30% of their income for housing rose during this period. In 2013, 37 percent of households in the state had this level of “burdensome” housing costs compared to 30 percent in 2000.